


The Seafarers Happiness Index (SHI) has been tracking crew welfare for a decade, offering the industry’s clearest view of life at sea from the people who live it.
The latest Q2 2025 results show an industry making modest but meaningful progress, though key pain points like shore leave, workload, and gender disparity, still demand urgent attention.
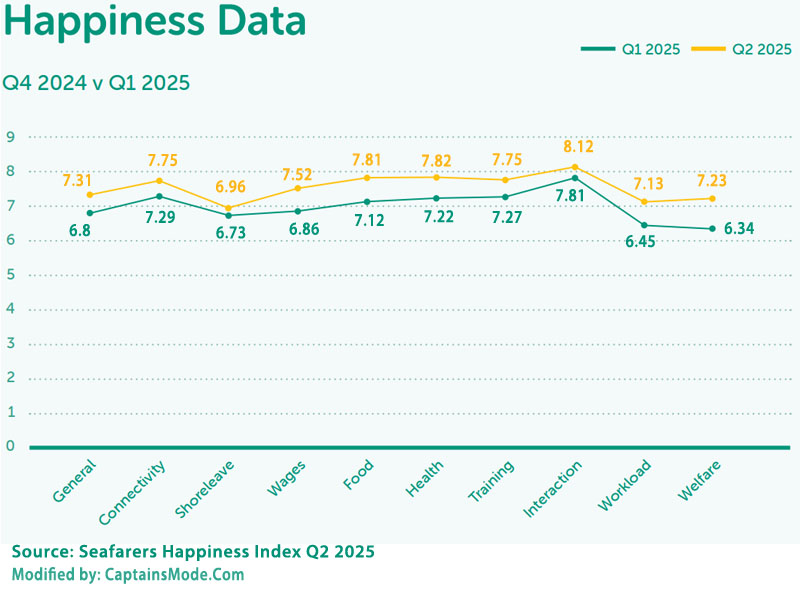
TL;DR – Key Stats Q2 2025
- Overall happiness: 7.31/10 ↑ from 6.8 in Q1
- Happiest category: Interaction with crew – 8.12 ↑ from 7.81 in Q1
- Lowest score: Shore leave – 6.96 ↑ from 6.73
- Notable gainers: Welfare (+0.89), Wages (+0.66), Food (+0.69)
- Happiest ship type: Cruise ships – 8.4
- Least happy crew: Second Officer – 6.3
- Happiest crew: Captain – 8.2
⚓ What is the Seafarers Happiness Index?
The Seafarers Happiness Index is a quarterly survey run by The Mission to Seafarers, designed to measure the wellbeing and job satisfaction of maritime professionals worldwide.
Since its launch in 2015, the SHI has evolved into a critical barometer for crew welfare, influencing policy, HR practices, and safety initiatives across global shipping.
📈 Are Seafarers Happier in 2025?
Yes, but only slightly.
The Q2 2025 overall score rose to 7.31, continuing an upward trend from Q1’s 6.8 and significantly higher than the lows seen during the pandemic.
Most categories scored above 7.0, a first in recent years, showing that investments in crew welfare such as improved internet, better food, and expanded welfare facilities are yielding results.
However, systemic challenges remain:
- Shore leave is still the lowest-scoring factor (6.96)
- Workload and administrative burdens remain high
- Gender gap in happiness persists (Male 7.6 vs Female 6.7)
- Fatigue and safety culture issues continue to threaten wellbeing
This means while more seafarers report being satisfied overall, critical operational and welfare issues still impact daily life onboard.
🧭 How is Seafarer Happiness Measured?
The SHI survey evaluates crew satisfaction across 10 critical workplace factors, each scored on a 1–10 scale.
This includes feedback from deck officers, engine crew, ratings, and specialist roles across various vessel types- from bulk carriers to cruise ships.
Each score is an average out of 10:
| Category | Q2 2025 Score | Change from Q1 |
|---|---|---|
| 😊 General Happiness | 7.31 | ↑ from 6.8 |
| 🌐 Connectivity (Contact with family) | 7.75 | ↑ from 7.29 |
| 🏖️ Shore Leave Access | 6.96 | ↑ from 6.73 |
| 💰 Wages | 7.52 | ↑ from 6.86 |
| 🍽️ Food Quality | 7.81 | ↑ from 7.12 |
| 🏥 Health & Fitness | 7.82 | ↑ from 7.22 |
| 📚 Training Opportunities | 7.75 | ↑ from 7.27 |
| 🤝 Interaction with Crew | 8.12 | ↑ from 7.81 |
| ⚡ Workload Management | 7.13 | ↑ from 6.45 |
| 🏋️ Welfare Facilities | 7.23 | ↑ from 6.34 |
Key takeaways:
- Interaction remains the highest-scoring factor.
- Welfare facilities saw the largest quarterly jump (+0.89).
- Even low-performing categories saw modest gains, indicating gradual improvement.
🏆 Who’s the Happiest and Least Happy by Rank?
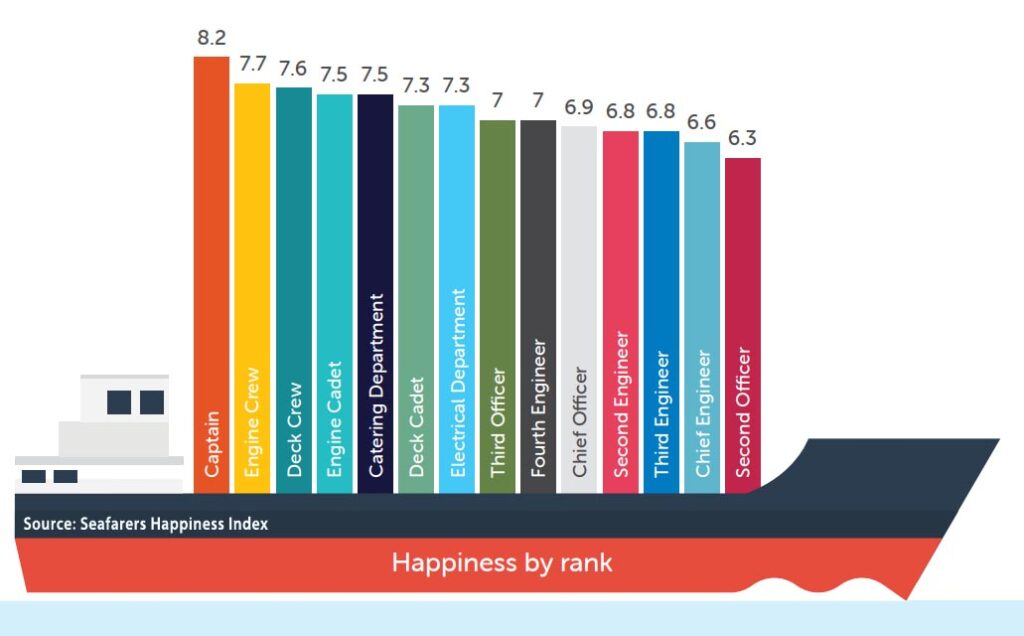
The SHI 2025 data shows rank strongly influences happiness.
Captains lead maritime happiness with 8.2/10.
Top 3 happiest ranks:
benefit from higher autonomy, better accommodation, and increased respect, contributing to superior job satisfaction.
- Captain – 8.2
- Engine Crew – 7.7
- Deck Crew – 7.6
Least happy ranks:
- Second Officer – 6.3
- Chief Engineer – 6.6
- Third Engineer – 6.8
Possible reasons:
- Masters have greater autonomy and better pay
- Engine and deck crew often have fewer responsibilities
- Officer and Engineers face high responsibility but less influence on decisions
🚢 Which Type of Ship Has the Happiest Crews?
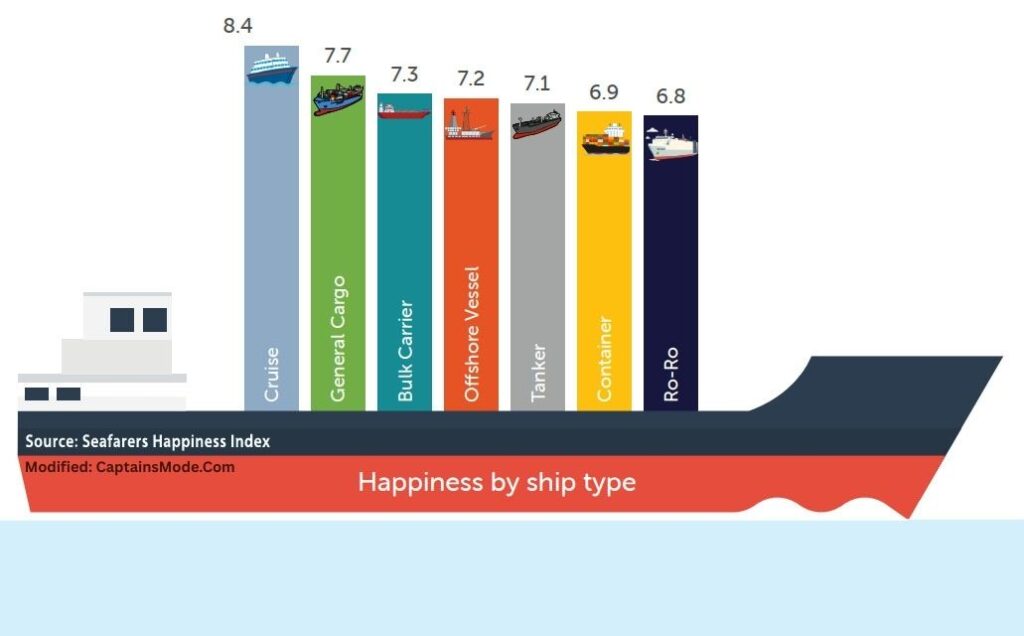
Happiness scores vary significantly by vessel type:
Top 3 happiest ships:
- Cruise ships – 8.4
- General cargo – 7.7
- Bulk carriers – 7.3
Least happy ships:
- Ro-Ro vessels – 6.8
- Container – 6.9
- Tankers – 7.1
The data suggests passenger-focused ships like cruise liners may offer better facilities, more shore leave opportunities, and richer social interaction, boosting morale compared to industrial cargo ships.
😎 Who’s Happiest by Age Group?
The SHI Q2 2025 shows younger seafarers lead in happiness, but the differences are subtle.
Happiest age ranges:
- 16–25 years – 7.9
- 25–35 years – 7.8
- 35–45 years – 7.5
Least happy age range:
- 65+ years – 7.0
- 55–65 years – 7.1
- 45-55 years – 7.2
Why the gap?
- Younger crew may enjoy novelty, social life onboard, and career-building momentum
- Older crew may face fatigue, monotony, slower promotion cycles, and health limitations
- Operational demands and long contracts may weigh more heavily with age
📅 Happiness by Contract Length
Contract duration has a direct impact on morale:
| Contract Length | Score |
|---|---|
| 1–3 months | 7.2 |
| 3–6 months | 6.6 |
| 6–9 months | 6.0 |
| Over 12 months | 5.8 |
| 9–12 months | 5.4 |
Insights:
- Shorter contracts = higher happiness – shorter rotations allow more frequent home time
- Mid-length contracts (6–12 months) see sharp drops due to fatigue and disappointment
- The slight rebound for over-12-month contracts may reflect niche sectors where extended stays are offset by better pay or conditions
🚻 Happiest Gender at Sea
The 2025 SHI confirms a persistent gender disparity:
| Gender | Score |
|---|---|
| Male | 7.6 |
| Prefer not to say | 6.8 |
| Female | 6.7 |
This nearly 1-point gap suggests female seafarers face additional challenges:
- Limited career advancement opportunities
- Isolation or lack of female peers onboard
- Gender-related discrimination or lack of tailored welfare facilities
Action point: Industry recruitment drives must be paired with targeted support systems, mentorship programs, and policies that address female-specific challenges.
💰 Are Seafarers Happy With Their Wages?
Wages scored 7.52/10, an improvement from 6.86 in Q1 2025, but underlying issues remain.
Positive Notes:
- Many officers and skilled ratings report “good salary compared to shore jobs.”
- Shorter contracts often boost perceived value of pay.
Concerns:
- Inflation impact – Salaries haven’t increased since 2012, but costs keep rising.
- Payment deductions – Reports about payments taken from seafarers by companies, and the loss of earnings through commissions and exchange rate discrepancies.
- Value perception – When wages are divided into 12 months, the real annual value can feel less competitive.
- Salary discrepancy – Nationality-based pay disparities for identical work create tensions within multinational crews.
- Reduced Benefits – Simultaneous reduction of benefits and allowances.
For aspiring seafarers, knowing these wage patterns helps set realistic expectations about maritime career earnings and financial planning.
❓ FAQs
Q: What is the Seafarers Happiness Index?
A quarterly global survey by The Mission to Seafarers measuring crew happiness across 10 categories, combining scores and narrative feedback.
Q: Why are captains the happiest?
They enjoy higher pay, autonomy, better quarters, and more respect, leading to better work-life balance.
Q: Why are cruise ships better for crew morale?
They offer better food, recreation, shore leave, and shorter contracts compared to cargo vessels.
Q: How does contract length affect happiness?
Longer contracts mean more family separation and fatigue. Happiness drops from 7.2/10 (1–3 months) to 5.4/10 (9-12 months).
Q: Are wages keeping up with inflation?
No. Many report stagnant salaries since 2012, reducing purchasing power despite modest satisfaction scores.
You can participate in the survey by visiting The Seafarers Happiness Index. The website also shows complete results of the previous surveys, to which this post was inspired.
📌 Conclusion – Why Crew Happiness Matters
The Seafarers Happiness Index Q2 2025 proves that investing in crew welfare works.
From better food to improved internet, each enhancement boosts morale and retention.
For maritime professionals, understanding these trends helps shape smarter career choices.
For shipping companies, prioritizing crew happiness isn’t just good ethics- it’s essential for safety, efficiency, and long-term competitiveness.
📌 Seafarer happiness is not a luxury – it’s a safety and retention imperative.
May the winds be in your favor.
Leave a Reply